Executive Summary:
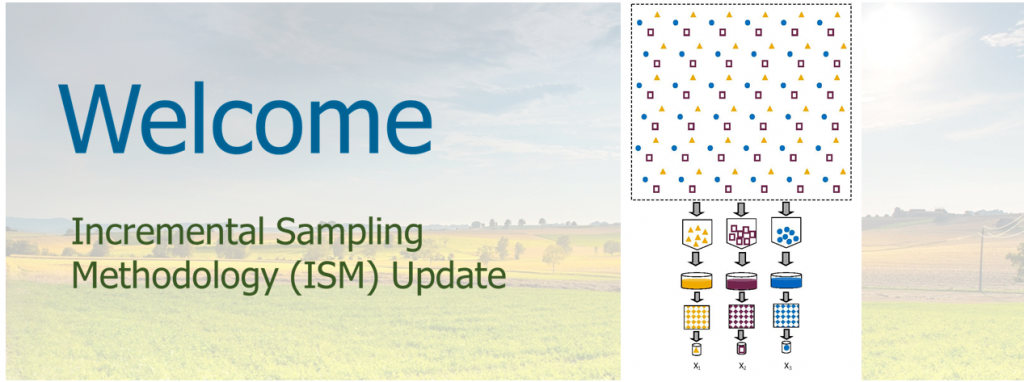
Incremental Sampling Methodology (ISM) is a structured composite sampling and processing protocol that reduces data variability and provides a reasonably unbiased estimate of mean contaminant concentrations in a volume of soil targeted for sampling. ISM provides representative samples of specific soil volumes defined as decision units by collecting numerous increments of soil (typically, 30 to 100 increments) that are combined, processed, and subsampled according to specific protocols.
ISM is increasingly used in the environmental field to sample contaminants in soil. Proponents have found that the sampling density afforded by collecting many increments, together with the disciplined processing and subsampling of the combined increments, in most cases yields more consistent and reproducible results than those obtained by more traditional (that is, discrete) sampling approaches.
Overall, members of the ISM Team have found that ISM provides reliable and reproducible sampling results and leads to less uncertainty better and more defensible decisions than have typically been achieved with many traditional sampling approaches. Such improvements result from the inherent attributes of ISM and the details of its implementation, including a clearer connection between sampling objectives and sampling approach. ISM works to address and overcome the sampling errors associated with soil sampling, integrates attention to detail in planning and field work, and requires attention to quality assurance/quality control measures throughout the sampling effort, not just in the laboratory. ISM also affords an economy of effort and resources. Generally, it would take dozens of discrete samples from any particular area to approach the reliability in an estimate of the mean provided by a well-designed incremental sampling approach. As a result of the advantages and improvements inherent in ISM over traditional methods, ISM is finding increased use in the field, as well as acceptance and endorsement by an increasing number of state and federal regulatory organizations.
How to Use This Guidance
This document is arranged into the following sections:
- Section 1 – Introduction. This updated ITRC Incremental Sampling Methodology guidance document (ISM-2) was developed to build on the 2012 version (ISM-1) and to reflect advancements in technology and share case studies that provide insight into the potential applications, benefits, and challenges of the approach. The ISM-2 Update Team also determined that clarification of the ISM-1 guidance was necessary. That clarification statement is now appended at the beginning of the ISM-1 document. ISM-1 continues to be a useful tool for those interested in learning the concepts of ISM.
- Section 2 – Nature of Soil Sampling provides the reader with an understanding of the unique challenges associated with sampling soil for the purpose of obtaining representative contaminant concentrations and how ISM is specifically designed to address these challenges. Contaminants in soil and other particulate media are often distributed unevenly at the scales of interest to decision-makers. Conventional soil sampling approaches that fail to address this heterogeneity can result in over- or underestimating contaminant concentrations, leading to decision errors. Section 2 provides the reader with a detailed understanding of why contaminants are heterogeneously distributed in soil, the consequences of that heterogeneity for soil sampling and decision-making, and how ISM is systematically designed to address this heterogeneity through the use of replicates of multiple increments. This section also discusses how data variability caused by soil heterogeneity is measured, as well as provides a simplified introduction to Gy theory, which is the basis for ISM procedures to increase the representativeness of soil data without breaking the budget.
- Section 3.1 – Systematic Planning and Decision Unit Designation provides a summary of the key aspects of systematic planning and DU design in relation to the collection of soil and sediment samples that have unique applicability or challenges using ISM sample collection. As with any sampling event, characterization must generate data in three dimensions so that data needs are met for a range of technical users who participate in the site investigation process. This means collecting data that inform each step of problem formulation: source area identification, fate and transport, and exposure/risk. Examples illustrate the key aspects of systematic planning and DU design.
- Section 3.2 – Statistical Concepts and Calculations for ISM answers the question, “Why use statistics?” Statistics can be used to answer important questions bearing on decision confidence:
- Is the sampling and analysis design giving accurate information?
- Are the data good enough to support confident decisions?
- Are there enough data points to make decisions?
- Section 3.3 – Planning for the Use of ISM Data describes the application of statistical concepts to ISM work plans (WPs) for use in decision-making. Specifically, this section will discuss DQOs steps 5 and 6 as they apply to ISM. The intent is to provide a link between the DQOs, the sample plan, and the data quality evaluation (Section 6).
- Section 3.4 – Cost-Benefit Analysis provides a cost-benefit analysis of ISM sampling relative to more traditional sampling methodologies, including factors such as time to project completion, and shares example case studies to assist in the determination of how ISM may be appropriate for a specific site.
- Section 4 – Field Implementation, Sample Collection, and Processing describes practical methods for collecting consistently sized increments for surface soil, subsurface soil, and sediment from various environments. The sampling method includes guidance on field planning, locating samples, sampling tools, collection and field processing procedures, decontamination, sample handling, and sample shipping.
- Section 5 – Laboratory Sample Processing and Analysis presents current practices and options available to process and subsequently analyze field samples obtained via ISM. Incremental sampling has been successfully implemented at numerous sites for a variety of contaminants, and multiple options are available depending on contaminants such as metals, pesticides, dioxins/furans, semi-volatile organic compounds (SVOCs), VOCs, PCBs, perchlorate, white phosphorus, and energetics (propellants, explosives, and pyrotechnics).
- Section 6 – Data Quality Evaluation demonstrates how to determine if your ISM data are sufficient for your purpose(s) and provides guidance on using appropriate statistical methods for data evaluation and confident decision-making.
- Section 7 – Regulatory Acceptance describes the regulatory environment surrounding the use of ISM, including typical regulatory concerns, problems, or incentives that may apply. This section also presents the state of regulatory acceptance for ISM by comparing its use since 2009 as well as practical guidance for working with or within a regulatory agency to gain consensus for using ISM in investigations, risk assessments, and confirmation sampling.
- Section 8 – ISM for Risk Assessment provides guidance for use of ISM data in risk assessment and risk-based decision-making. Key concepts in this go-to resource include the importance of understanding the nature and extent of contamination when designing EUs, the necessity of ISM replicates for calculating EPCs (and how to calculate EPCs), background comparisons using ISM data, and communicating ISM-based risk assessment results.
- Section 9 – Stakeholder Input discusses applicable stakeholder concerns, points of view, and interaction with the remediation process or other issues discussed.
- Appendix A – Case Study Summaries provides information regarding ISM design, implementation, and assessment methodologies. The case studies presented were selected based on their relevance to the use and application of ISM.
- Appendix B – Statistical Simulations – updated from ISM-1.
ISM Manages Micro-scale Heterogeneity:
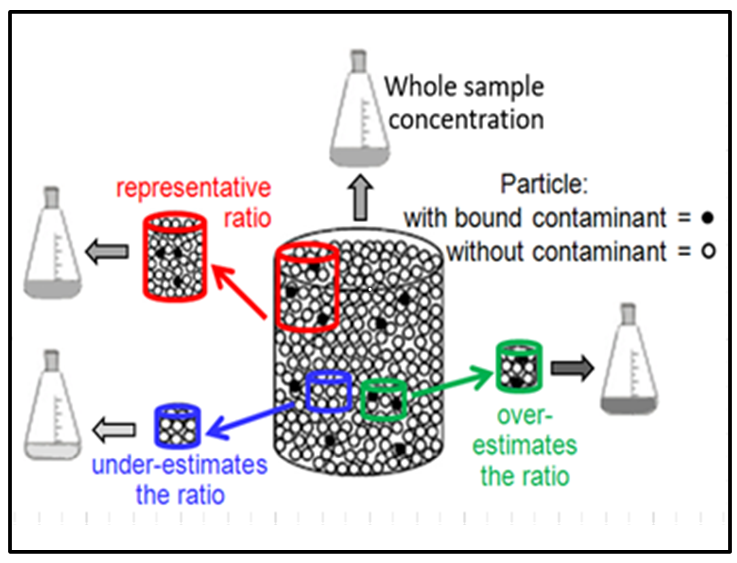
A subsample obtaining a representative ratio of nuggets to cleaner particles depends on subsample mass. A sampling error occurs when the subsample does not mirror the ratio of the field sample, producing a significantly higher or lower concentration result.) See Fig 2-7 in Sect 2.4.1 for more information on how ISM actively manages micro-scale heterogeneity in soil where nuggets contribute to high data variability.
ISM Addresses Grouping Errors:
Contaminants grouped by deposition mechanisms [red dots] may bias the sample estimate of the DU mean if sample collection is biased.
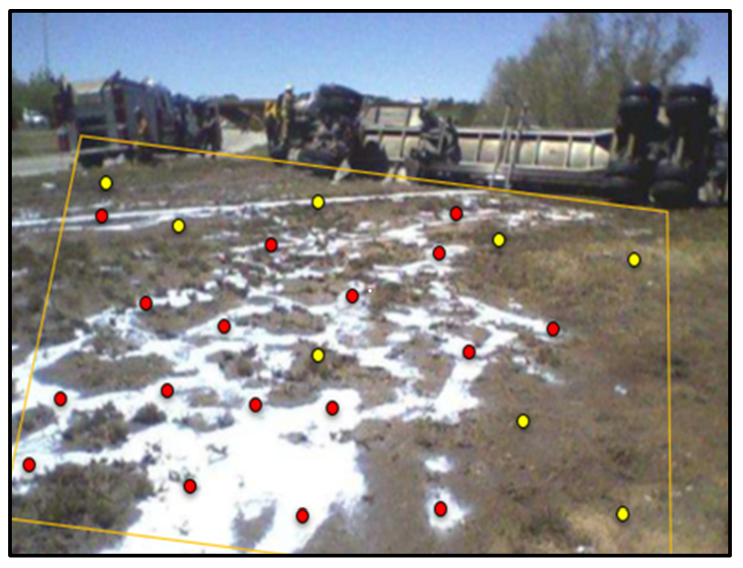
ISM helps effectively account for heterogeneity of contaminant distribution across the study area which is prevalent at investigation sites. ISM minimizes decision errors as would occur if individual samples are collected solely from either red or yellow sample locations. See Fig 2.22 in Section 2.6.2.2 for information on how ISM uses systematic random field sample locations for increment collection to avoid this bias.
Decision Units Examples:
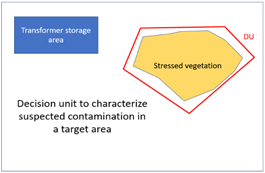
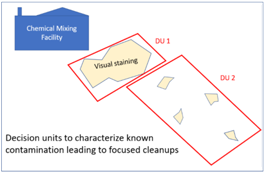
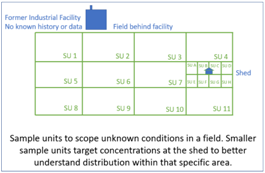
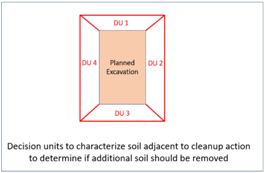
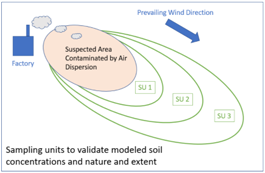
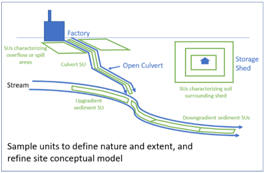
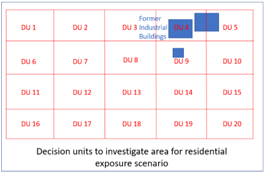
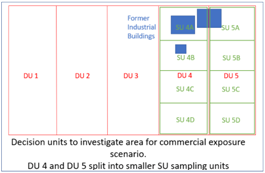
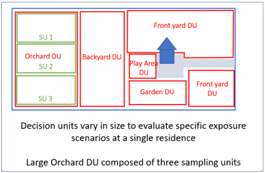
The determination of sizes and arrangement of DUs or SUs is always project-specific and dependent upon the conceptual site model (CSM) and end use of the data. Figure 1-1 from Sect 1 demonstrates just a few simplified examples of the diversity of DU and SU sizes and uses. Examples for designing DUs are presented in Section 3.1.
ISM Tools Available:
Checklist: Prior to Field Implementation:
Before proceeding with field implementation, the following checklist can be used to help ensure that adequate planning unique to ISM has occurred. Have you:
| Topic: | Question: |
| DQOs | identified the problem/decision to be made? |
| identified objectives/goals? | |
| ensured that the inputs I have designed meet these objectives? | |
| made sure that I understand the CSM (see Section 3.1.2 through 3.1.4)? | |
| DUs/SUs (see Section 3.1.5.1 and Section 3.1.5.2) | evaluated size and depth relative to decisions to be made? |
| evaluated if the DU design can be adjusted to serve all data needs (statistics, nature and extent, background, risk assessment, and so on)? | |
| mapped out shape and considered site’s physical constraints? | |
| Increments and Samples | identified the appropriate number of increments per DU/SU (see Section 2.5.2 and Section 3.1.5.5) |
| considered if pilot or early replicates for unassessed areas are warranted prior to full-scale implementation? | |
| designed an increment sampling path that ensures unbiased locating of increments (see Section 3.1.5.4)? | |
| considered resulting ISM sample size relative to scale of decision-making? | |
| Laboratory | confirmed the processing steps to be conducted by the laboratory (see Section 3.1.5.3 and Section 5)? |
| confirmed the sample analysis procedures to be used by the laboratory (see Section 3.1.5.3 and Section 5)? | |
| considered QC samples and frequency needed for data validation and statistical analysis (see Section 3.2)? |
After reviewing Sect 4, you should be able to complete the following checklist to ensure proper field preparation and implantation. Have you:
| Question: |
| allocated appropriately trained staff to execute the task? |
| identified site-specific means of marking out a DU calculated the increment size based on the sample design total volume? |
| identified the appropriate tool(s) to obtain each increment from the required depth? |
| assessed if a mass reduction technique will be needed during increment collection? |
| requested/obtained sample containers specific to ISM (large volume, special considerations for VOCs for ISM)? |
| considered the added resources for sample storage (added ice and coolers)? |
| communicated to the laboratory the required processing and QC requirements for the chain of custody |
These checklists are available in Section 4’s Regulatory Context Field Implementation, Sample Collection, and Preparation section.
Cost Comparison Calculator:
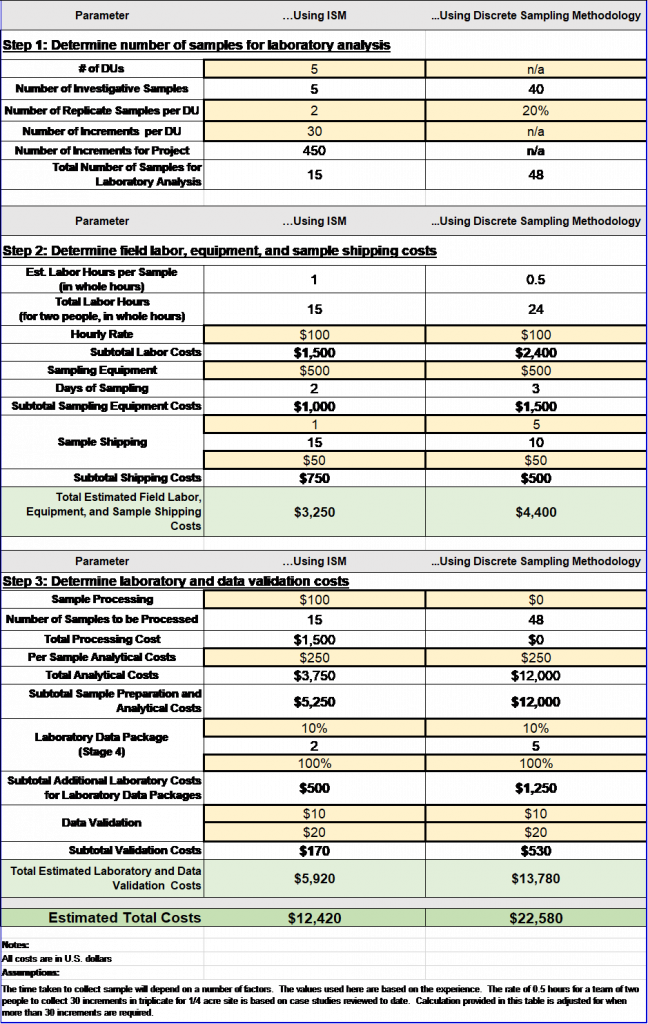
Costs for ISM may be much lower than the costs of discrete sampling, and the data used to make decisions are less likely to mis-characterize remaining contamination and lower the potential for remobilization and continued excavation and soil treatment.
Using the cost comparison calculator presented in Section 3.4.1.1 the field and laboratory costs can be estimated as in Table 3-10.
ISM 95% UCL Calculator:
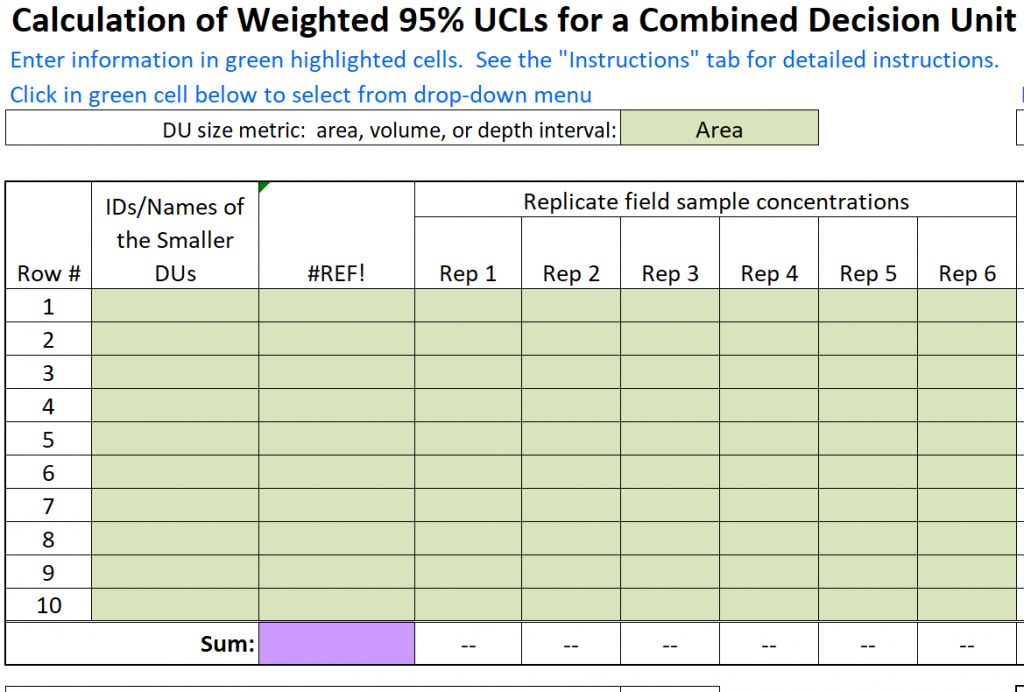
Equations for ISM Student’s-t and Chebyshev 95% UCLs were programmed into an Excel spreadsheet file that is in Section 3.2.4.1 (ISM 95% UCL Calculator):
The ISM 95% UCL calculator built by the first ISM Team has been updated since then with an improved modeling procedure. This calculator has several benefits:
- The user only has to enter the results of three to six replicate field samples, as well as the number of increments per sample (not shown on the image below).
- The ISM 95% UCL spreadsheet calculates both the Student’s-t and Chebyshev 95% UCLs.
- The spreadsheet recommends which 95% UCL should be used.
ISM Training Resources:
The newly updated Incremental Sampling Methodology (ISM) training is a series of six modules providing an overview of ISM and presenting five sections from this ITRC guidance document (ISM-2, 2020). You are welcome to watch the two sessions (Session 1 for Module 1-3 or Session 2 for Module 4-6) below:
- View ISM Training Session 1 Archive
- View ISM Training Session 2 Archive
- View ISM Training Q&A Digest
Click Here to download the entire document.


